The final blog in the IoT Platform series demonstrates how to fully utilize the platform by working with drivers, devices, sensors, data ingestion, visualizations, and integrations. It also explores advanced features such as dataviews, zones, maps, reports, alerts, simulations, and panels to showcase the platform’s complete capabilities.
This is the last blog from the series about installing the IoT platform, so if you are new here, you can go through the latest blogs to get these applications set as you will see here.
After installing the IoT platform, stream, OpenReports, Flow, and OpenPlatform we can achieve the full potential of what the IoT platform offers. In this blog, we will go through some simple examples to get an overview of what the platform offers.
The main point of this application is to receive, save, and present real time data or historic data to the user. So the first thing we need is a method to get this data into the IoT platform. For this purpose we installed stream, but we need to process data in the IoT platform and we can do that with drivers.
Drivers
Drivers are a core part of this application. They can receive and process data from different kinds of devices. Different devices will need different drivers. So for example, if you want to receive data from a meteo station and electrometer, you will need an individual driver for each. Bud for more meteo stations of one kind you will need just one driver.
Because there are a lot of options for sensors, you can create custom drivers right in the IoT platform. There you can define which inputs and outputs it has to include, the endpoint, where you will receive data and you can code some operations with the data. It is also possible to create a driver, that will be connected to a camera for example and it can send requests for data at some intervals.
Driver can also have configuration and settings if you need to set separate configurations for drivers. And in the driver, you can add storage, for saving custom data from the drivers. For example, if you connect your driver to a camera, which can send you data about passing cars, you can save to the current architecture only value, but in the driver, you can create a custom database, that can contain different kinds of data, like vehicle license plate, color, type and etc.
Detailed information about how to create a driver can be find in the Total.js documentation.
Devices and sensors
When we have our driver ready, we can go to the Device section to create our device. After clicking on the Create button, we have to choose a driver and then we can fill in information about the device. The serial number is very important for every created device because based on it received data will be assigned to the device.
You can also fill in here data like reference, color, icon, locality, latitude, and longitude.
After submitting a new device, we can already see some meta information about the device with information about the chosen driver. Below that, we have listed all sensors associated with the device with their state, current value, and the date and time when the data was received.
Sensors
Sensors are created automatically after creating a device, based on a chosen driver. As we know from the previous part of this blog, every driver has their sensors defined in it.
If we want to see all sensors listed in one place, we can do it in the Sensor section. Here, we can see information about every sensor like locality, value, serial number, alerts, time, when the last value was received, and state. By clicking on a sensor, we will see a report with historic values received on that sensor with possibilities to filter in these values or export them to a CSV file.
Data ingestion in the IoT platform
When we have prepared our device like this, it is ready to receive data. With this driver, data have to be sent to the endpoint /airq/, and the data structure has to look like this:
Where devEUI has to be the same as the serial number defined in the device. If in the received request is any value missing it will go through without error and other values will be processed.
I will show you an example request in the application RapidAPI, of how the platform process received data. We will use data from above. The URL has to be http://0.0.0.0:8001/airq because our stream is running on this URL and the endpoint is dedicated to this driver. Do not forget about headers, when we have to have an x-token with value Total, because we set this value for a security token in this driver in the previous blog about IoT stream application.
As you can see, after sending a request, sensors change their state to online and values are displayed in the data grid.
Dataviews
If you have a case, where you need to combine data from more sensors, it is easily possible to do so in the Dataviews section of the IoT platform. It is possible to choose sensors, operations, format, and decimals. In the example case, we want to make a Sum operation of two temperatures. For this, we need to click on the Create button, fill in a name, and operation, and select the temperature sensors, that we want to Sum. You can put their different kinds of units, but in our case, we will fill into a formatted input a °C, because we want to render the unit with the resulting value.
Zones and Map
Values obtained with dataviews and sensors can be inserted into zones and then rendered on the map. First, we need to create a zone. The zone is the location on the map, where sensors are located. For creating a zone we need to know where we want to draw a zone. Then we can add sensors, which should be part of it.
Also, we can create a category for a zone. Each zone can be part of one category like parking, city building, school, etc.
Map
Every zone can be rendered on a map. In our example, we have only a zone Test with sensor Temperature in it. When we go into a Map section, we can see our zone, after zooming in a box will appear above the zone with the name of a zone and sensor name with the last received value. By clicking on that box a bigger form will appear with listed sensors, their values, and graphs. Each graph has a filter, where we can set what types of values we want to see.
Also, if you have zones with categories, you can filter which categories you want to see on the map. With this is very easy to keep an eye on zones in your interest.
Reports
We talked about reports already in the blog where we went through the installation of OpenReports, but here it is a slightly different approach. From reports created in OpenReports, we can get functional APIs with a few clicks. First of all, we have to pair our OpenReports with IoT platform application. We will do that by going to the OpenReports setting, allowing an API for reading reports and copying a link. Then we will put this link in the IoT platform Settings section in the part OpenReports.
With this setup, we can go to the Reports section and create our first API access. Here, we have to click on the Create button and choose one of the existing reports in the OpenReports. In our case, we have here only one with the name Test, which created in the previous blog about the installation of the OpenReports application. When we click on it, we will get a form, where we can fill in some information about this report, we can make it inactive or add token verification.
After submitting a form, our report will appear on our page with information about how many times it was called and we can copy a link for this API here. After copying this URL address to the browser, we will get the report in the CSV form.
Alerts
Alerts are an important part of monitoring the states of devices. Every device can have some problems and with this, we can see them all in one place. These alerts can be invoked in more ways. It could be invoked in the driver, for example, if a camera, should be sending us data after the request is not responding or we can process data in the flow, evaluate them and based on some conditions we can create an alert.
In this case, I will show you how to create an alert from the Flow application. In the previous blog about the Flow installation, we connected the received data with the Flow by TMS component. Now we will expand our Flow with components Data sorter, Alert message, IoT Stream / alert, and Print.
In the Data sorter, I filled in a condition, that we want to send to the next component only data, where a sensorid is airq_temperature because it is an id for the temperature sensor and the value has to be more than 40 degrees. Alert message component will extend our object with a message Temperature is higher than {value}, where value will be replaced by real value. This is sent to the next component, which is the IoT Stream / alert, which will send this alert to the IoT platform.
Simulations
This section is created only for testing purposes and shouldn't be a part of the production version. Its purpose is to simulate a physical device if we want to test the functionality of our platform without hardware.
Here, we have to create an endpoint, where we want to send simulation data. Then we have to prepare a CSV file and upload it to the form, select one of the endpoints, and the frequency of sending data to the endpoint. We can also launch a request and choose if we want to circulate data from the simulation file or if it should go only once through this file.
Panels
Panels are implemented by creating a small page for information displays. For example, we can imagine a case, that we have meteo values from some school building, we can have a display in the entry room, where everyone can see measured values like temperature, humidity, and more. This page is updated dynamically by received data, so it is very easy to implement by just opening a URL address on that display.
Now we can move to implementing panels in the IoT platform. First of all, we have to create a panel in the IoT platform. In the form, we will fill in a name, width, and height. After submitting this form, the panel will appear on the page and we can Copy the Flow URL address.
With this address, we have to go to the Flow application and create a component by clicking on the Create button and choosing an option Link endpoint. In the form, I will fill in a name, category, and copied URL address.
Now we have prepared our components and now we need to create a simple flow architecture.
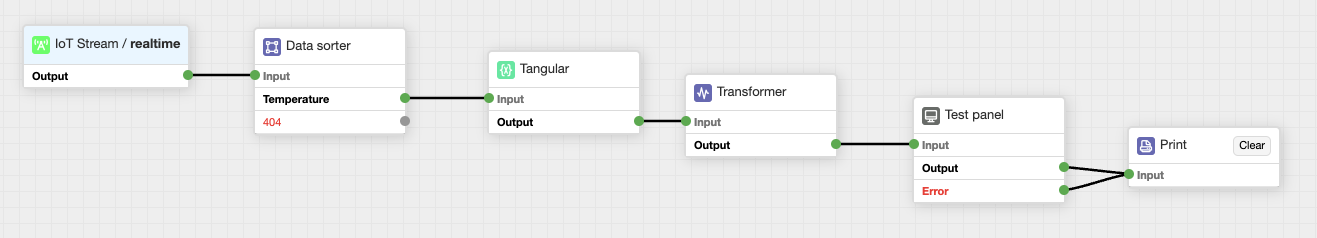
In the architecture, we can see new components which are Tangular, Transformer, and Test panel. Tangular is important because we need to put content for a panel page into HTML. In this case, I want to render only one value, which is the temperature on a small page, so our HTML content can look like this (we will get there only values from the temperature sensor from a particular device, based on the condition in the Data sorter component):
Now we have to change the data structure to the form suitable for the Test panel component and we can do that in the Transformer component with code like this:
Now, when our platform receives data, from a particular device, temperature data will go through this architecture and the value will be rendered to our small page.
Conclusion
That is all to our IoT platform series of blogs for now, I hope you learned something new from these blogs and I will happily share with you more knowledge about Total.js.
Video part 1:
Video part 2:
Other posts from Total.js Platform
- 2026-04-01March report 2026
- 2026-03-02February report 2026
- 2026-02-02January report 2026
- 2026-01-02December report 2025
- 2025-12-15Totally Merry Christmas and a Happy New Year 2026!
- 2025-12-01November report 2025
- 2025-11-02October report 2025
- 2025-10-22New universal drivers for IoT Platform
- 2025-10-13IoT Platform Update: New Features and Enhancements
- 2025-10-01September report 2025