This blog continues the IoT platform installation series by guiding you through installing and setting up OpenReports, a flexible reporting tool from Total.js. You’ll learn how to connect it to your database, create views, and generate reports, enabling you to analyze and manage your IoT data more effectively.
This is a continuation of a series for the installation of the IoT platform. In the previous blog, we talked about how to install Stream application and in this blog, we will continue with the installation of the OpenReports application. In the next blogs, we will install Flow and OpenPlatform, to show you, how you can use all these apps together, to get a great application to handle and analyze your data from diverse IoT devices.
If you haven’t heard about the IoT platform or you want to get more information, please read this blog about the IoT platform first or watch this video describing the IoT platform. Please, keep in mind, that this platform is part of Total.js enterprise.
Why do you need OpenReports?
It is not necessary to use OpenReports with the IoT platform, but it can help you increase your ability to analyze and manage your data. OpenReports is an independent application and you can use it also for other purposes, so if the IoT platform is not for your case, you can still use OpenReports for all different kinds of data based on your case.
What is OpenReports?
OpenReports is a powerful reporting tool developed by Total.js. It is designed to simplify the creation and management of reports. It is a flexible application that can integrate with various data sources customizable based on your data architecture. It can generate reports in formats such as Excel or CSV with a user-friendly interface.
Installation of OpenReports
We will continue with the assumption, that you followed the previous blogs about IoT platform and stream, but this tutorial does not depend on it. So you can install OpenReports based on this blog and use it for also other cases.
Download source code and install dependencies
First, we have to download the application from a GitHub repository and save it to a directory. We can do it via the terminal with the code:
We installed all dependencies in the previous tutorial, but if you are new here, just follow your terminal console or review previous blog posts.
Update port
We run the IoT platform and stream on ports 8000 and 8001, so we have to go to the index.js file and change the port to another, in this case, we will set it to port 8002.
This is how our index.js can look:
Now we can run the application by terminal command:
Now our application is running on **port 8002 **and we can access it via a web browser.
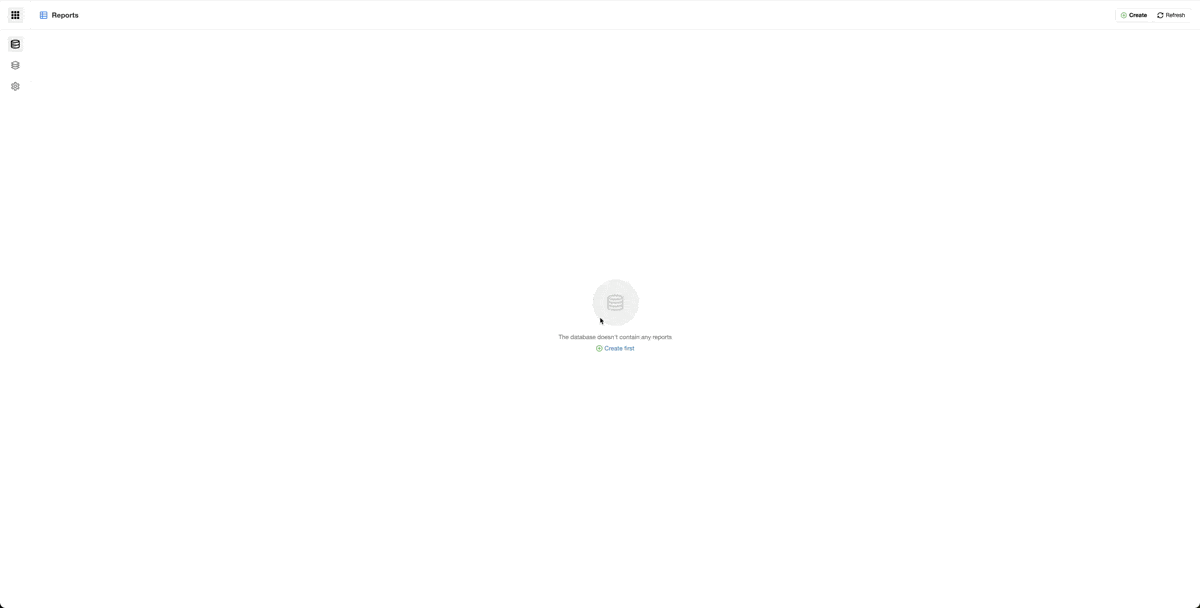
Connect OpenReports to the database
The next step is connecting to our database. When we enter OpenReports it is empty, so we will navigate to Settings and fill in a connecting string to our database (same as for IoT platform and stream applications).
Creating a view
Then we can continue to create a view of our data. For this, we need to know our database architecture. In this example, I will use only basic data, for example purposes, but you can create views and then reports based on your case.
We have to go to the section View and click on the button Create. Then we can add there a JSON to specify our view. This JSON should look like this:
id is an identifier for our view, name is name, SQL is SQL query to our database and fields are fields that we want to include with column for data, name, and data type.
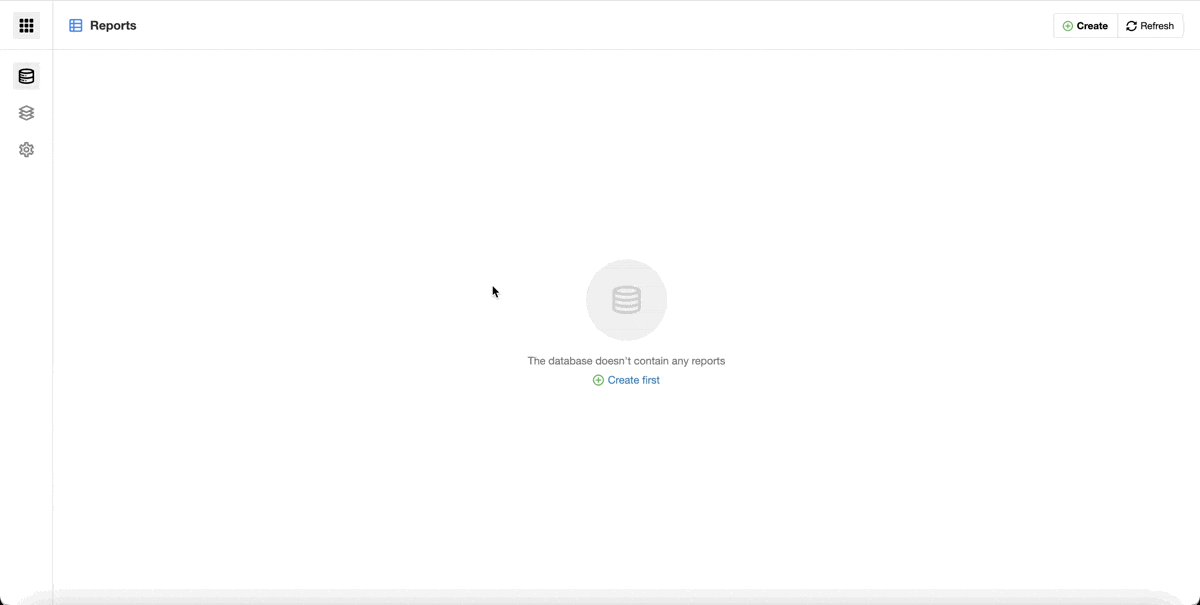
Creating a report
With this, we can continue to create our first report. We have to navigate to the section Reports and click on the button Create. A form will appear, where we can modify our reports to our needs, but in this example, we will create just a simple report. We have to fill in a name for our report and choose a view, so in our case, we will use the name Test and as a view, we will use the previously created view Hodinové (which means Hourly).
As you can see on the gif report is usable right after creation. Just like this, you have access to all your data from your database and you can go through them via the OpenReports application, or you can download them as CSV or Excel.
Conclusion
That is all to this blog. Now you are able to install the IoT platform, stream, and OpenReports and now you are able to create a view and report. There is a lot more that you can achieve with this application, but this was just a simple explanation of how to install it and start using it.
I hope you learned something new with this blog and I will happily share with you more knowledge about Total.js.
Video:
Other posts from Total.js Platform
- 2026-04-01March report 2026
- 2026-03-02February report 2026
- 2026-02-02January report 2026
- 2026-01-02December report 2025
- 2025-12-15Totally Merry Christmas and a Happy New Year 2026!
- 2025-12-01November report 2025
- 2025-11-02October report 2025
- 2025-10-22New universal drivers for IoT Platform
- 2025-10-13IoT Platform Update: New Features and Enhancements
- 2025-10-01September report 2025